
2.1 Accreditation
2.2 Costs and Funding
2.3 Demographics
2.4 Size of the Program
2.5 Entrance Requirements
Conclusion
SECTION TWO: SCHOOL PROFILES
School promotional materials are filled with diverse and potentially valuable
pieces of information. In fact, it is usually through such profiles that
interested students will judge which university programs are worth applying
to. Moreover, these materials give students a visual image of the school
and a first taste of what it would be like to actually attend that institution.
This section analyses base categories of information about the schools:
Accreditation, Costs and Funding, Demographics, Size of the Program, and
Entrance Requirements.
The limitations experienced in developing this section, for the most part,
stem from a lack of information as only student handbooks and the Association
of Collegiate Planning Schools 1993/94 Guide to Urban and Regional Planning
were used. Consequently, some of the information is outdated and hence not
a true reflection of current fees, student profiles, and statistics. Also,
it should be noted that where data was found for more than one year, it
was often evident that there can be substantial variations between years
is some categories (i.e. demographics and enrollment).
2.1 Accreditation
Introduction
Accreditation is granted to planning programs across North America that
meet standards determined by national organizations of professional planners.
These standards encourage quality education for the preparation of future
practitioners of professional planning. In Canada the body that determines
these standards is the Canadian Institute of Planners while in the United
States, the Planning Accreditation Board has this responsibility.
The Canadian Institute of Planners, or CIP, has been dedicated to the advancement
of planning since 1919 (CIP Website). In addition to accrediting university
programs in Canada, this body also certifies planners, sets standards for
membership, establishes codes for professional conduct, and provides continuing
education for its members. The CIP also publishes a journal, Plan Canada,
six times a year. The CIP has affiliates in all provinces and in the Northwest
Territories. These affiliates include the Planning Institute of British
Columbia, the Alberta Association of the Canadian Institute of Planners,
the Association of Professional Community Planners of Saskatchewan, the
Manitoba Association of the Canadian Institute of Planners, the Ontario
Professional Planners Institute, LOrdre des Urbanistes du Quebec, and the
Atlantic Planners Institute (CIP Website).
The Planning Accreditation Board, or PAB, accredits planning programs based
on standards approved by the PAB and its parent organizations, the American
Institute of Certified Planners (AICP), the American Planning Association
(APA), and the Association of Collegiate Schools of Planning (ACSP) (PAB
Information Sheet). Of these bodies, the AICP, which is the American counterpart
to the CIP and the professional institute of the APA, provides the only
national certification of planners. APA members can become certified through
the combined qualifications of work experience, training, and passing a
written examination. The APA, the largest American association of planners,
provides many benefits to its members such as technical information, skill-building
opportunities, a monthly magazine, and local chapters in individual states
(APA Website). Finally, the ACSP, founded in 1959, is an organization of
university departments and schools that teach urban and regional planning.
ACSPs purpose is to enhance and promote education and research in the field.
In addition, the ACSP produces a detailed Guide to Graduate Education in
Urban and Regional Planning (ACSP Website).
Method of evaluation
The accreditation status of the planning programs was determined from two
sources:
1. Student handbooks produced by the universities; and
2. The ACSPs 1993/94 Guide to Graduate Education in Urban and Regional Planning.
Both sources were utilized in order to cross-check the information.
Limitations
Determining the accreditation status of the universities covered
in this study proved to be a confusing process for a number of reasons.
First, and foremost, it was difficult to assess the differences between
the various accrediting bodies listed in the schools materials, particularly
with regards to the American planning schools. For example, many schools
listed that they were accredited by either the AICP, the APA, or by the
ACSP or by all three bodies without explaining the associations or differences
between them (the one exception to this was UCLA). It was only upon further
research, and through the review of the ACSPs 1993/94 Guide to Graduate
Education in Urban and Regional Planning, that the linkages among these
organizations and the role of the Planning Accreditation Board became clear.
Second, many school handbooks did not clearly identify the association between
state or provincial affiliates and the main accrediting bodies. This could
also lead to confusion especially for those international students who may
be reviewing the handbooks.
Findings
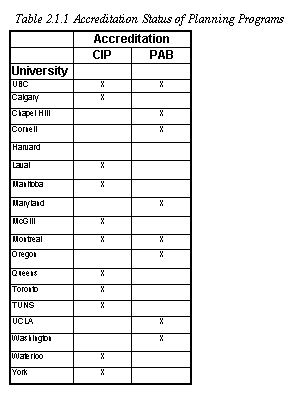
All university planning programs in Canada included in this study are accredited
by the CIP and all American programs are accredited by the PAB (with the
exception of Harvard). It is notable, however, that two of the Canadian
universities, UBC and Montreal, are accredited by the PAB as well, thus
giving them both Canadian and American accreditation status (Table 2.1.1).
Table 2.1.1 Accreditation Status of Planning Programs
Summary
Although the full benefits of attending an accredited university are not
clearly identified in most school handbooks, the value of accreditation
status should not be underestimated. For students, the opportunity to become
members of these national organizations of professional planners holds many
benefits which include networking opportunities, financial support through
scholarships, and educational opportunities. Moreover, for students enrolled
in programs that have both Canadian and American accreditation status, such
as UBC, even more networking and thus employment opportunities become available.
Thus, schools have the responsibility to make clear to their potential and
enrolled students, through both their handbooks and through on-going communication,
the distinctions between associations and benefits of belonging to an accredited
planning program in North America.
2.2 Costs and Funding
Introduction
For many students, tuition costs as well as the availability of financial
aid determine the universities to which they will apply. In this section,
the tuition fees of the various planning programs included in this study
are compared to the tuition charged by UBC. As well, the various avenues
through which students can access and obtain financial support are explored.
Method of evaluation
All tuition fees included in this analysis were obtained from the student
handbooks of each university. In those cases where tuition fees were not
included in the handbooks, numbers were derived from the Association of
Collegiate Schools of Plannings 1993/94 Guide to Graduate Education in Urban
and Regional Planning, and therefore may not indicate current tuition rates.
Those universities with out-of-date tuition rates include Montreal, McGill,
Waterloo, TUNS, Cornell, UCLA, Oregon, and Washington. Information concerning
financial aid was taken solely from the student handbooks.
Limitations
Tuition
A number of limitations which influence the accuracy of
the information derived for this section can be identified. First, current
tuition costs are being compared to outdated tuition fees (1994 rates).
Second, for the sake of consistency, all tuition costs were calculated on
an annual basis. Problems arose when schools listed their tuition costs
on a semester, trimester, quarterly, or per credit hour basis. In those
cases, the annual tuition was calculated by determining the length of the
program and the number of credits required to complete the program. For
example, the program offered by Laval is 5-6 trimesters and can be completed
over a two year period. Therefore if the cost of one trimester is $750,
this number must be multiplied by three in order to get the rate for one
year (or three trimesters). The annual tuition at Laval is thus Cdn$2250.
The third limitation is that all American tuition costs had to be converted
to Canadian funds in order to allow for an easier comparison between the
schools. As a result, American tuition rates do not reflect the fluctuations
of the Canadian dollar. The exchange rate used for the conversion calculation
was Cdn$1.00 = US$.744 (September 28, 1996).
Financial Aid
As was mentioned, information concerning financial aid was
obtained from current school handbooks. Consequently, information collected
varies depending on the amount of information which the schools included
in their handbooks. For instance, some schools such as UBC provided detailed
information concerning financial aid, while others (e.g. Waterloo) were
very general in their discussion.
Findings
Tuition
The tuition fees paid by students vary according to residency.
For example, students living outside of Canada (out-of-country) usually
have to pay a higher tuition fee than students who reside in the country.
This is also typical of the United States, with the one difference being
that higher tuition fees are generally charged to students not only living
outside of the country but outside of the state as well (out-of-state).
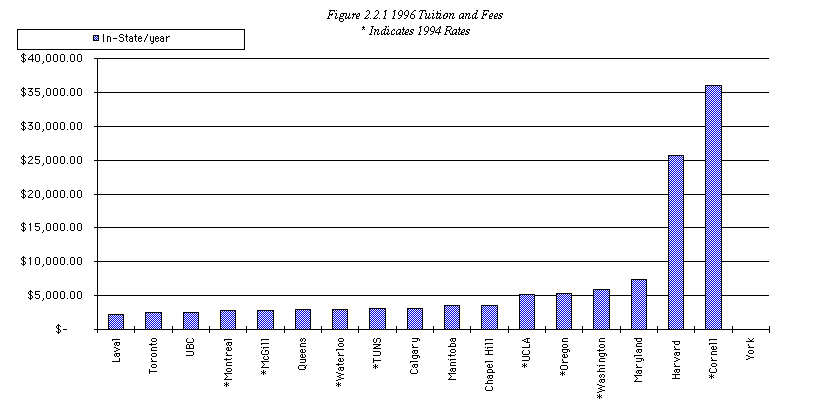
When comparing the in-state (US) and in-country (Canada) tuition rates charged
by UBC to other planning programs included in this study (refer to Table
2.2.1), a number of interesting observations can be made. Firstly, UBC charged
the third lowest fee of all the universities ($2530) (the lowest and second
lowest being Laval at $2250 and Toronto at $2478). Secondly, Canadian universities
charged lower tuition fees than their American counterparts, with the highest
Canadian tuition fee being charged by the University of Manitoba at $3500.
And thirdly, American programs were two (UCLA) to fourteen (Cornell) times
more expensive than UBC, the one exception to this being North Carolina
which charged only 1.4 times ($3600) the amount of UBC.
Out-of-state (US) and out-of-country (Canada) fees charged by universities
are even more striking. Among the Canadian universities, only UBC and Manitoba
charged the same in-country and out-of-country tuition rates, whereas, all
other schools charge two to almost four times the amount for international
students. A similar situation exists for American schools. Cornell and Harvard
charge the same in-state and out-of-state tuition fees (which are relatively
high) while other schools charge from two to approximately nine times the
amount for out-of-state students (i.e. North Carolina at Chapel Hill charged
an in-state tuition of $3600 and an out-of-state tuition of $34,425). Please
refer to Figure 2.2.1 for a comparison of in-country (in-state) and out-of-country
(out-of-state) tuition and fees.
UBC 97 UPDATE
There will be an increase in fees for international students in the 1997-98
year.
Table 2.2.1 Costs and Funding
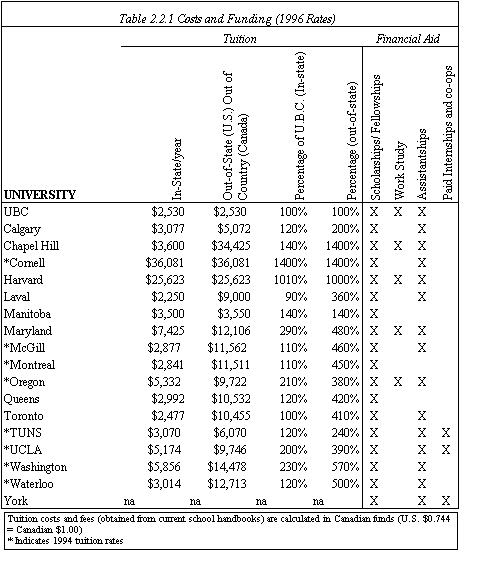
Figure 2.2.1 Tuition and Fees
Financial Aid
All university planning programs included in this study
offered some form of financial aid. For example, all 18 of the programs
offered scholarships and fellowships. Fifteen of the schools indicated that
they offered assistantships, both research and teaching, with the only exceptions
being Manitoba, Montreal, and Toronto. Five of the schools alluded to the
work study programs that they offered (UBC, Harvard, Maryland, North Carolina,
and Oregon) and only three schools said they provided paid internship and
co-op opportunities (York, TUNS, and UCLA). It also should be noted that
some universities, particularly in the United States, provide financial
aid by waving out-of-state tuition fees.
Summary
When comparing tuition fees, both in-country or state and out-of-country
or state, it becomes clear that UBC is one of the more reasonably priced,
and therefore, accessible schools in this study. This becomes particularly
evident when comparing out-of-country or state costs. As well, UBC in comparison
to other planning schools appears from these materials to offer an equivalent
range of financial aid opportunities (but note a later comment suggesting
that UBC is not as competitive as other schools given its experience with
acceptance rates).
2.3 Demographics
Introduction
In the 1993/94 Guide to Urban and Regional Planning, the Association of
the Collegiate Schools of Planning included a profile of the students in
the various planning programs. The profile had been divided into five categories
which included the numbers and percentage of minority students, international
students, women, and the numbers of full-time and part-time students in
both the Masters and Ph.D. programs. Also included in the guide were the
numbers of female and male faculty members that taught on a full-time basis.
These charts have been reproduced in this section. It was felt this information
should be included in the analysis as there are few alternative avenues
available to students for accessing this type of information. For example,
only three of the student handbooks used in this study alluded to the demographics
of their student body (UCLA, Calgary, and McGill).
Methodology
The information included in this section was gathered from the ACSPs 1993/94
Guide to Urban and Regional Planning.
Limitations
Many factors limit the quality of the information included in this
section. The first limitation is that student demographics are continuously
fluctuating. Assuming that schools do not set specific and regimented quotas
concerning the types of students that they will admit into their programs,
each new year brings with it a unique class which is unlike any other. Therefore,
the data used in this section is only a snapshot of the types of students
that are being admitted into various planning programs. The second limitation
is that much information was not available in the ACSPs Guide. For instance,
many schools did not include information on the numbers and percentages
of minority and international students. As this was the only source of information
for this section, many cells had to be left blank in the analysis. And the
third limitation is that overlap is not reflected in the profile. That is,
there is no column, for example, which shows the numbers of minority women
versus men or the numbers of international students who can be classified
as minorities. This chart must therefore be viewed with caution.
Findings
Specific findings of each category will be discussed in turn.
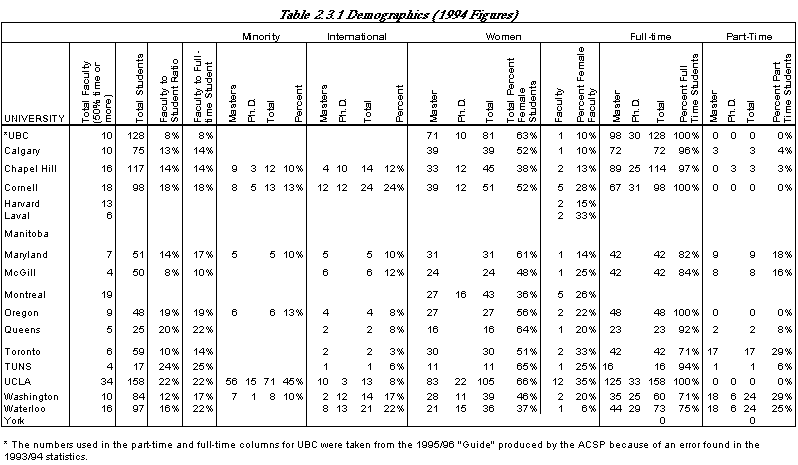
Table 2.3.1 Demographics
Minorities
As much of the information under this category was not available
(Table 2.3.1), it was difficult to compare the number of minority students
admitted into the different planning programs. Nevertheless, a few observations
can be noted. The first is that most American schools, with the exception
of Harvard, were able to complete their profiles on minority students while
no information in this area was available from the Canadian universities.
The reasons for this can only be guessed, although the fact that the ACSPs
Guide is an American publication (thus allowing them to access statistics
of American programs more readily than Canadian) could be a factor. Another
factor may be that US affirmative action policies may be stronger then Canadas.
The second observation is that, of the American schools, UCLA seems to admit
the greatest number of minority students (45%), while other universities
seem to admit less than 13%.
International
As with the data for minority students, that for international
students is also quite sparse. One apparent trend, however, is that the
numbers of international students admitted into programs tends to be quite
low (less than 12%), with a few noteworthy exceptions being Waterloo at
22%, Cornell at 24%, and Washington at 17%.
Women
The combined information concerning the number of women admitted
into planning programs of both the Masters and Ph.D. level is intriguing.
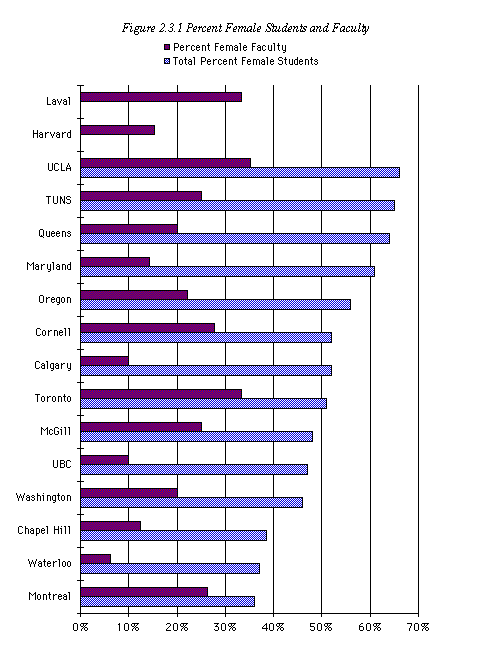
Of the 14 schools which included this information, more than half of them
(8) had more than 50% of their student body made up of women. Indeed, four
of those schools had more than 60% women (Queens at 64%, TUNS at 65%, UCLA
at 60%, and Maryland at 61%). Of those programs that had less than 50% of
female students the numbers ranged from 36% at McGill to 47% at UBC. Refer
to Figure 2.3.1 for a comparison of the percentage of female students to
female faculty members.
Faculty
Keeping in mind the large numbers of female students admitted into
planning programs, it is interesting to compare the numbers of full-time
female faculty members (50% time or more) affiliated with these schools
to the number of male professors. Of the 16 universities which included
this information , none had an equal number of female and male professors.
In fact, only three schools had greater than 30% female faculty members
(Laval at 33%, Toronto at 33%, and UCLA at 35%). The remaining schools had
less then 30% female professors, 6 of which had less then 15%. Those schools
include UBC at 10%, Calgary at 10%, Chapel Hill at 13%, Harvard at 15%,
Maryland at 14% and Waterloo at 6%.
Judging from these statistics and those from the previous section, it can
be concluded that the planning profession, although it appears to be moving
toward gender equity, is still dominated by male faculty.
Figure 2.3.1 Percent Female Students and Faculty
Full-Time vs. Part-Time Students
The one observation that can be made in this category is that only
four of the schools included in this study have no part-time students enrolled
in their program (UBC, Cornell, Oregon, and UCLA).* This can be contrasted
with the other planning schools that have close to 30% of their students
enrolled part-time, the most notable being Toronto at 29%, Washington at
29% and Waterloo at 25%..
Summary
As UBC does not include statistics on minority students and international
students in the ACSPs Guide there can be no comparison with the other schools
included in this study. In terms of the number of female students admitted
into UBC, however, the school compares quite favourably as it admits close
to 50% women into its program. Unfortunately, the same cannot be said for
the number of female faculty members as compared to males affiliated full-time
at UBC. Only 10% of UBCs faculty is female. Although many other universities
also had a poor gender balance, there were three notable exceptions where
the gender imbalance was less (UCLA at 35%, Laval at 33%, and Toronto at
33%). Finally, with regards to full-time vs. part-time students, UBC is
one of four schools not enrolling part-time students into its program (the
other three being Cornell, Oregon, and UCLA).
2.4 Size of the Program
Introduction
As most students are aware, the competition to be accepted into a Masters
or a Ph.D. program is fierce. Only a selected few of those who apply for
such programs are offered admission, and of those, only a small percentage
of students actually enter the program. It is thus the intent of this section
to assess just how competitive UBCs program is with the other planning programs
included in this study. The categories of statistics included in this section
are the numbers of masters students who enter masters programs annually,
the number of students offered admission, the differences and percentages
between the two, the number of students that apply for the programs, and
a percentage of those that enter compared to those that apply.
Methodology
Generally, information included in the schools handbooks did not prove to
be very useful for this section. For the most part, schools only included
information on the number of students admitted yearly into the programs
and little else. Hence, the information used in this section was taken from
the ACSPs 1993/94 Guide to Urban and Regional Planning. It is also worth
mentioning that only 1994 numbers included in the guide were used in this
analysis.
Limitations
The limitations encountered in this section are similar to those
which were faced in the demographics section in that the numbers used are
continuously fluctuating. For instance, the number of students that apply,
are offered admission, and enter the masters program, change from year to
year. Thus the numbers used here can only be viewed as a sample of the students
that might be admitted into a planning program in any given year. Moreover,
as some schools did not provide some information in the Guide, many cells
had to be left blank in the analysis. These schools included Laval, Manitoba,
York, and Harvard.
Findings
A number of interesting conclusions can be drawn from the analysis of this
section (Table 2.4.1). The first is that universities seem to offer admission
to one and one-half to three times the number of students that they feel
would be an appropriate number for their program. For example, UBC, which
on average admits 30 students per year, offers admission to almost double
that number in order to ensure that all spaces will be filled. Other schools,
such as Queens or Waterloo, however, seem to be quite accurate in their
estimation of how many students will enter their programs and therefore
only offer admission to an additional 5 (or less) students. In contrast,
Cornell offered three times as many places compared with those who enter
their program. Refer to Figure 2.4.1 for a percentage of the number of admittants
that enter the various programs.
It was also noticed that among the Canadian planning programs, UBC seems
to be the second most popular, judging from the number of applications they
receive (140) (the most popular school being Queens which received 144 applications
in 1994). Among the American universities, UCLA seems to be the school most
favored by students (it received 296 applications in 1994) followed by Washington
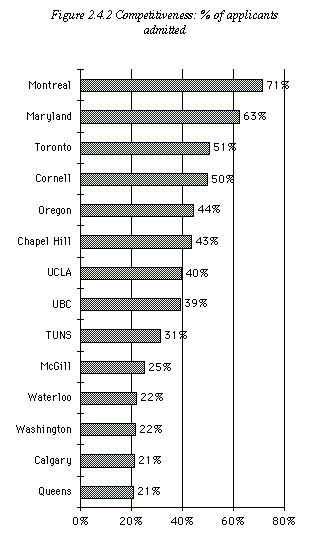
(208) and North Carolina at Chapel Hill (198). Refer to Figure 2.4.2 for
a comparison of the competitiveness of each program.
A further observation is that less than 25% of the students that apply for
planning programs are actually admitted. Universities which appear to have
more favourable chances for entrance are Toronto where 39% of the students
that applied were admitted and Maryland where 34% of the students were granted
admission.
Finally, it should be noted that the size of masters programs included in
this study are quite consistent. It appears that most schools enroll from
20 to 30 new students every year, the only exceptions to this being UCLA
which admits approximately 60 students annually and North Carolina at Chapel
Hill which allow about 40 students to enter.
Table 2.4.1 Size of Progam
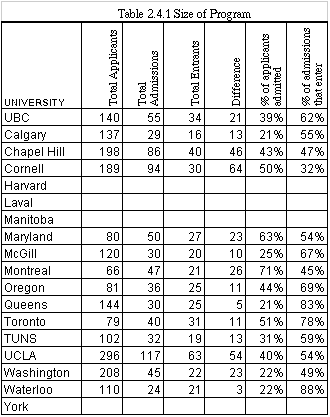
Figure 2.4.1 Desirability: % admittants that enter
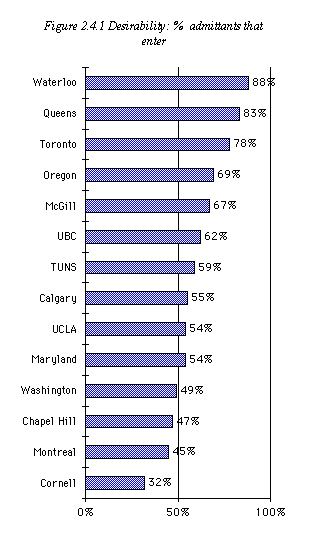
Figure 2.4.2 Competitiveness: % of applicants admitted
Summary
From the analysis it becomes evident that the size of UBC (i.e. the number
of students that enter the program annually) does not vary too greatly from
the other planning programs included in this study. Certainly, 20-30 students
admitted per year seems to be the general size of planning programs across
Canada and even in the United States with the exceptions of UCLA and North
Carolina at Chapel Hill. The final observation is that the planning program
offered by UBC appears to be quite popular in Canada given the large number
of applications it receives. The probability of acceptance at UBC, however,
appears to be less than at Toronto or McGill, but better than other Canadian
schools where data was available.
2.5 Entrance Requirements
Introduction
Before being admitted into a masters program, certain academic and professional
requirements must be met. This section examines the requirements which students
must fulfill in order to be accepted into the planning programs included
in this study. In the findings and concluding sections, these various requirements
will then be compared to UBC. The specific requirements that are analyzed
include the Grade Point Average, Required Degree, Professional Experience,
and the Graduate Record Examination.
Methodology
The information included in this section is more current as it was obtained
from recent university handbooks.
Limitations
Only a few limitations were encountered in this section. The first
was that under the prerequisites column, only the most frequently mentioned
required and recommended courses were included. As well, because the information
included was obtained solely from the schools handbooks, any information
which failed to be included in the handbooks was not included in this analysis.
Hence, the blank cells in the chart indicate that no information was provided.
Findings
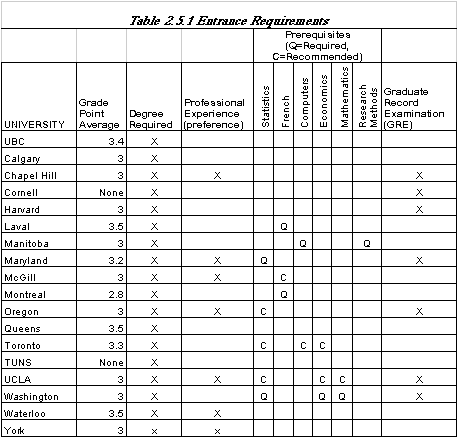
The findings for this section are presented in Table 2.5.1.
Table 2.5.1 Entrance Requirements
Grade Point Average
Most planning programs in this study required that entering students
have a grade point average of between 2.8 (Montreal) and 3.5 (Waterloo),
with the most frequently mentioned GPA being a 3.0. (UBCs GPA is 3.4). TUNS
and Cornell indicated that no specific GPA was required.
Degree Required
All universities required that entering students hold an undergraduate
degree from a recognized institution. As well, most of the schools in this
study listed acceptable undergraduate degrees that students enrolled in
their programs often seem to hold. Because the list of degrees specified
by each university is quite comparable, and because most were given as an
illustrative list, it was felt that for this analysis a detailed look at
each school would not be necessary. A broad list of those degrees most frequently
mentioned includes: social work, sociology, geography, political science,
urban studies, economics, biological and physical sciences, history, business,
law, fine arts, architecture, and landscape architecture.
Professional Experience
Only a handful of the universities stated that they gave preference
to students that had work experience. Those universities are McGill, York,
Waterloo, UCLA, Maryland, Chapel Hill, and Oregon.
Prerequisites
Both required and recommended prerequisites were listed by a number
of universities in this study. The courses most frequently mentioned by
the schools include statistics, French, computers, economics, mathematics,
and a research methods course.
The schools that required students to complete certain undergraduate courses
are as follows: Laval (French), Manitoba (computers and research methods),
Montreal (French), and the University of Washington which stipulated that
students entering the program should have credit for one college level course
in either statistics, economics, mathematics, American Government, environmental
systems, or cultural diversity.
Those universities recommending that entering students complete specified
courses include McGill (French), Toronto (statistics, computers, and economics),
UCLA (statistics, economics, and mathematics), and Oregon (statistics).
Graduate Record Examination
All American universities required that entering students write
and pass the Graduate Record Examination (GRE) which is not a requirement
for Canadian schools.
Summary
When comparing UBCs entrance requirements to those of other universities,
only subtle differences can be noticed. The first is that UBC has a slightly
higher GPA requirement than the other planning programs (3.4). The second
is that UBC does not give preference to potential students with work experience
unlike three other Canadian schools. Finally, the GRE is not a prerequisite
for students applying to Canadian graduate programs; only American schools
required the completion of this examination.
Conclusion
There are several main conclusions that can be drawn from this section which
have specific implications for UBC.
Accreditation
UBC and Montreal are the only two planning programs in this study accredited
by both Canadian and American accreditation boards.
Costs and Funding
UBC charged the third lowest tuition fee of all the universities included
in this study.
UBC was one of the only universities which charged the same in-country tuition
fee as out-of-country.
UBC provided a comparable range of financial aid opportunities as other
planning schools. UBC, however, does not provide paid co-op work terms or
internships.
Demographics
Approximately 50% of the student body at UBC is made up of women which is
comparable to other planning programs.
Like many other schools, UBC suffers from an extreme gender imbalance in
its faculty (i.e. 10% compared with those that have close to 40%).
UBC is one of four schools that do not have part-time students enrolled
in its program (the others being Cornell, Oregon, and UCLA).
UBC , like all Canadian schools does not provide data to enable comparison
of minority or international students.
Size of the Program
UBC admits approximately 30 students a year, which is comparable to most
other schools with the exceptions of Chapel Hill and UCLA.
UBC typically offers admission to approximately double the number of students
for which they have spaces. This can be compared with one and one-half to
three times the amount for other schools including Queens and Waterloo which
offer admission to less than five extra applicants.
Judging from the number of applications, UBC is the second most popular
planning school in Canada, although receiving 1/3 - 1/2 of the applicants
of the most popular US schools.
Less than 25% of the students that apply to UBC usually are admitted; this
is typical of most of the planning schools included in this study, notable
exceptions being Toronto (39%) and Montreal (32%).
Entrance Requirements
UBC sets a higher GPA (3.4) than all except one other planning program in
the study.
UBC, like other schools, requires that students, upon entering, have an
undergraduate degree from a recognized university.
UBC does not favour new applicants who have work experience over those that
do not unlike Chapel Hill, Maryland, McGill, Oregon, UCLA, Waterloo, and
York.
UBC does not require or recommend that students have credit for certain
courses before they enter the program. This contrasts with Laval, Manitoba,
Maryland, McGill, Montreal, Oregon, Toronto, UCLA, and Washington which
do have requirements.
In keeping with the other Canadian planning schools, UBC does not require
that its students compete the Graduate Record Examination.


