
4.1 Program Structure
4.2 Program Content
Conclusions
Section Four: Program of Study
As is clear from the preceding analysis of planning education philosophies,
there is a wide range of approaches taken. This is further reflected in
the actual program content and structure. This section examines the curriculum
of the eighteen schools and attempts to answer several key questions about
the program of study required for the professional planning degree.
- How much of the program is prescribed in core and required concentration
courses?
- How much is left to the student to determine through choices of elective
courses?
- What sort of independent study requirement is there in the form of a
thesis or project?
- Within the courses themselves, both required and elective, what topics
are covered, what diversity is available and how do these reflect various
sets of recommendations or frameworks proposed in the literature?
This assessment of the curriculum is based on the information provided in
the program handbooks that schools send out to prospective students. This
usually consists of short paragraph descriptions of the courses and a brief
overview of the degree requirements and program structure. Several limitations
are inherent in this approach - descriptions may not accurately reflect
the actual course content, and not all courses may actually be offered on
an ongoing basis (i.e. during a given students two year tenure, etc.) Nevertheless,
an overall profile of current planning school curriculums in North America,
and particularly Canada, can be gleaned, and UBCs place in the spectrum
of offerings can be seen.
4.1 Program Structure
Introduction
In attempting to prepare students for a career in planning, schools design
a mix of learning experiences. The relative value of these experiences is
beyond the scope of this study and probably varies with each individual
students goals and learning style. Schools attempt a balance of structure
and freedom, and the result reflects a mix of the schools perspective on
both the field of planning and the field of education.
Method of Evaluation
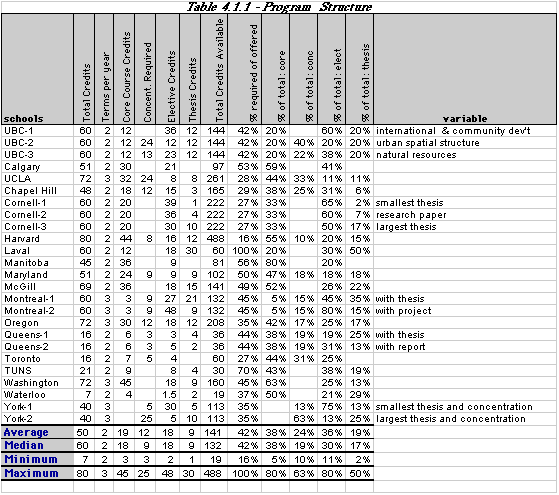
The credits required in core courses, an area of concentration, a thesis,
and electives for a Masters degree from each of the schools were listed
along with total credits required for the degree. Each program component
was then calculated as a percent of total credits to give comparable data
for each school. When individual schools had a range of program options,
these variations are shown as School-1, School-2, etc. This data is shown
in Table 4.1.1
The primary limitation with this method is that in most schools there are
subtleties, details and variations that are not expressed in a programs
introductory material. Also, programs are in flux, because other schools,
like UBC, are undoubtedly examining and refining their curriculum.
Table 4.1.1 Program Structure
Findings
Core Curriculum
In The Core Curriculum Revisited, Friedmann (1996)
essentially reconfirms Perloffs seminal 1957 concept of a common core (or
generalist) with a specialty, and uses this concept as a starting point
for the changes he proposes. Although to varying degrees, the data shows
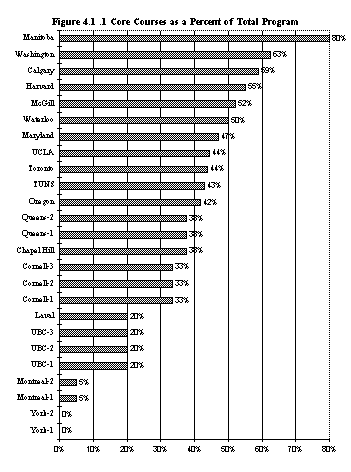
that planning schools are structured to this model. Except for York, all
of the schools have some course(s) required of all students. The proportion
of their degree made up of required courses ranges from 5% at Montreal to
80% at Manitoba, with most falling around the average of 39%. UBC is at
the low end, prescribing only 20% of students programs in common requirements.
Figure 4.1.1 illustrates core requirements as a percentage of the total
degree requirements (based on course credits) for each of the schools.
Figure 4.1.1 Core Courses as Percent of Total Program
Area of Concentration
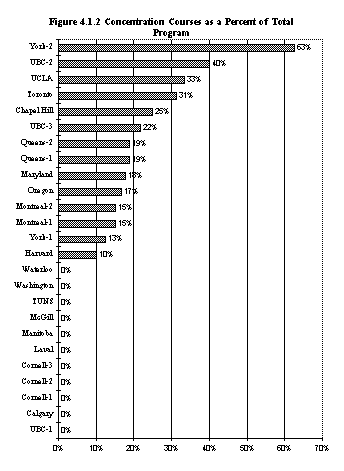
Half of the schools further require that a specific proportion
of credits be taken in the area of concentration. The proportion of courses
required in the concentration ranged from 10% at Harvard to 63% at York-2,
with an average of 25%. Chapel Hill has specific courses required for each
concentration. Two others, Oregon and UCLA, have one and two courses required
respectively, with additional concentration courses chosen from a longer
list of options. UBC varies depending on the concentration. At one extreme
are the International Development and the Community Development streams,
both with no specified concentration requirements. At the other extreme
is the newly added Urban Spatial Structure stream with concentration requirements
equaling 40% of the program. Of these credits, half are specified and half
are choices of one out of three or four options. The Regional and Natural
Resources stream falls in between with four courses required (20%).
At the remaining schools both the proportion and the content of elective
courses relating to the concentration are individually determined. Figure
4.1.2 shows the proportion of coursework expected in the area of concentration
in the schools that specify it.
Figure 4.1.2 Concentration Courses as Percent of Total Program
Thesis or Equivalent
Although all of the schools require a thesis or comparable independent
work, the definition and flexibility of this requirement vary widely. In
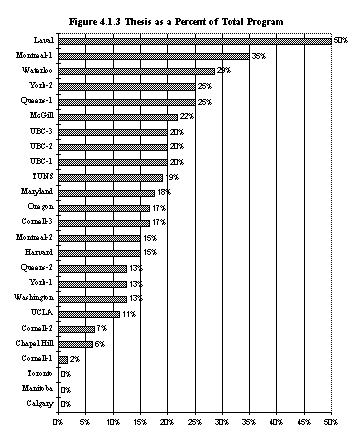
terms of overall proportions, the range is from 2% to 50% of the program,
with an average of 19%.
Four of the schools specify a Masters Thesis as a requirement and place
varying levels of emphasis on this as a portion of the total degree requirement
UBC (20%), Waterloo (29%), TUNS (19%), and Maryland (18%). The flexibility
of this requirement is unclear in terms of subject matter and format. Calgary
(no credit), Toronto (no credit), McGill (22%) and Chapel Hill (6%) all
specify a Masters Project or Report which seem similar to a thesis but perhaps
less rigidly academic and more practice oriented. Calgary and Toronto appear
to offer no credit for this component of the program. The other schools
offer options with varying credit, generally differentiating between a thesis,
a project, a report, and/or a research paper Queens (thesis - 25%, or report
- 12% ), Montreal (thesis -35%, or project 15%), Washington (thesis or project
- 13%), Oregon (thesis or project - 7% to 17%), York (thesis, paper or project
- 13%), and Cornell (thesis or project - 2% to 20%, research paper - 8%).
Harvard, Laval, and UCLA have the most practice oriented focus in their
thesis or equivalent requirement. Harvard and Laval offer a studio option,
alternatively students can choose to do a thesis. At Harvard this takes
the place of a fourth term studio option and one course, at Laval the thesis
takes the place of a group project worth four courses and six additional
elective courses. A third option at Harvard is all courses. UCLA offers
a thesis, a client oriented project, or a simulated client oriented project
as options - the first two options are worth two courses and the third is
held over two weeks, is offered by a faculty committee and receives no credit,
as it is essentially an examination. As indicated above, UBC is one of a
small group of schools offering a standard academic thesis for a fixed amount
of credits. At 20%, UBC ranks 7th highest in proportion of program taken
up by thesis. A desription of the various thesis or equivalent options can
be seen in Appendix A. Figure 4.1.3 shows the program proportions dedicated
to the thesis.
Figure 4.1.3 Thesis or Equivalent as Percent of Total Program
Electives
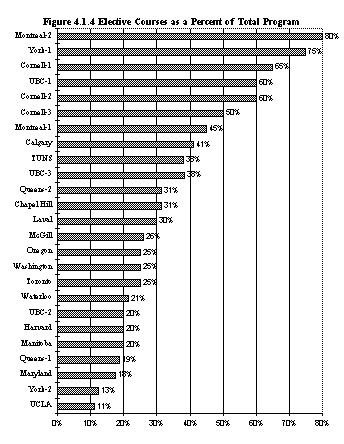
The remainder of the programs are made up of electives. This proportion
ranges from 80% at Montreal-2 to 11% at UCLA, with an average of 36% and
a median of 26%. At UBC, the range of flexibility varies between twenty
and sixty percent depending on the concentration. Figure 4.1.4 shows the
relative rank of the schools based on elective proportions.
Figure 4.1.4 Elective Courses as Percent of Total Program
4.2 Program Content
Introduction
What future planners should be taught is a subject that is debated continuously,
perhaps because there is no single answer for all potential planning roles.
It would be nearly impossible to summarize what is being taught by a sample
of planning schools without conducting a substantial survey with committed
participation by all of the schools. It was possible, however, to develop
a list of things that planning schools should teach based on the literature
and to see to what extent they address this material. The results of this
analysis are presented in this section.
Method of Evaluation
Two different articles were combined to create a framework for assessing
the courses. Friedmanns six sociospatial processes, previously discussed
in the mission statement analysis, were used in combination with his other
recommendations for a planning curriculum. Added to this was a breakdown
of quantitative methods derived from Kaufman and Simons, Quantitative
and Research Methods in Planning: Are Schools Teaching What Practitioners
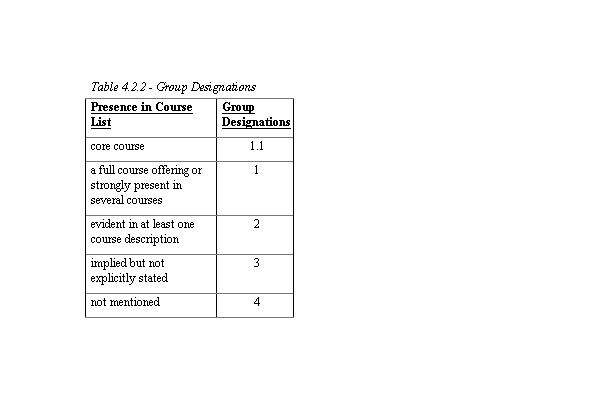
Practice? (1995). For each of the 50 categories derived from these
sources (Table 4.2.1) schools were given group designations (Table 4.2.2)
for each category, based on the course descriptions in the handbooks.
Table 4.2.1 - Topics Assessed
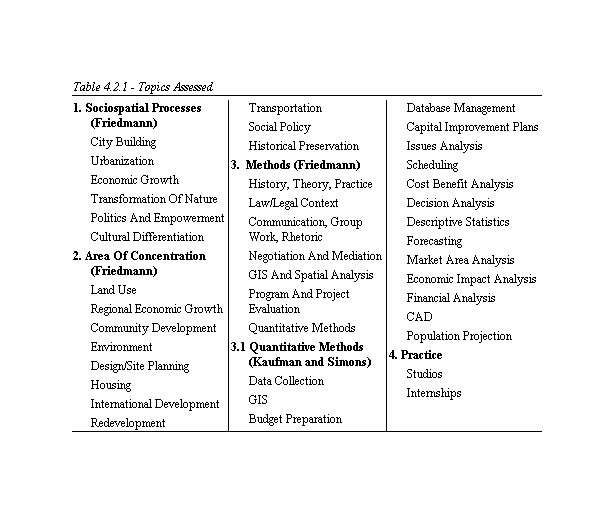
Table 4.2.2 - Group Designations
The limitations of this process are clear given the sheer number of variables,
the volume of source information and the inherent subjectivity of the method.
As mentioned earlier, the actual source data itself was problematic in that
what is said and what is done is likely to be different. However, some general
observations can be made about topical coverage and general trends in course
content.
Findings
Sociospatial processes
Of Friedmanns six sociospatial processes described in Section 3.1,
environmental and political processes are the
most strongly covered, with 94% of the schools covering each as a major
topic either as a core course (1.1) or as a full course offering (1). Adding
those schools that offer a course which includes the given topic (2), brings
urbanization up to 95% (from 89%) and empowerment
up to 89% (from 72%). This combination of core course (1.1),
full course (1), and covered in a course (2) is referred to as explicit
course coverage in this report. Economic and cultural
processes are both slightly less prevalent in explicit course coverage at
83% and 78% respectively. Table 4.2.3 illustrates the school by school comparison
of both mission statement and course coverage of these six topics. Figure
4.2.1 compares the ranking of course coverage and mission statement coverage
of these processes for each school.
Table 4.2.3 Comparison of School Coverage of Sociospatial
Processes in Courses and Mission Statements
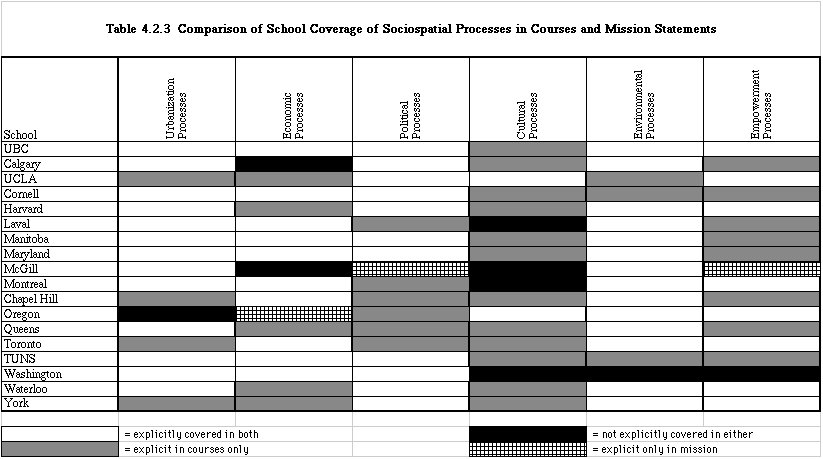
Figure 4.2.1 Explicit Coverage of Sociospatial Processes in Courses and
Mission Statements
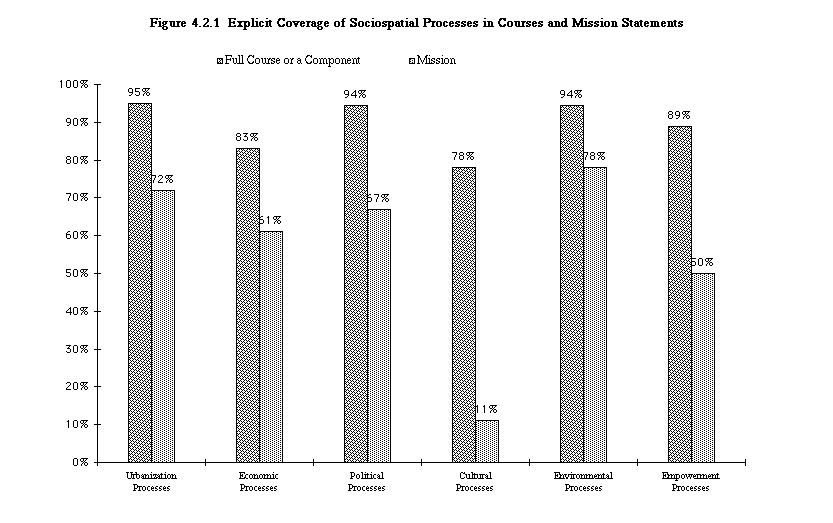
It is clear from this comparison that more schools cover these topics in
their courses than discuss these ideas in their mission statements. This
is particularly true of cultural processes which appeared very
infrequently in the mission statements and also less frequently than the
other sociospatial processes in the course descriptions. Nonetheless, cultural
processes were still explicitly taught in most of the schools (78%). Other
course topics that are offered but not mentioned in the mission of the departments
included empowerment and political processes.
There were three cases where a topic was discussed in the mission statement
but not readily apparent in the courses. For economic processes,
Oregon discusses the concept but fails to make it clear in the course descriptions.
At McGill both political and empowerment processes
were present in the missions but not clear in the courses. Ten of the schools
explicitly cover all of Friedmanns sociospatial processes in their courses
(UCLA, Cornell, Harvard, Manitoba, North Carolina, Queens, Toronto, TUNS,
Waterloo, and York). Another four (UBC, Calgary, Laval, and Montreal) are
explicit about five out of six processes and imply the sixth. Oregon is
only explicit about four, implying two others, while both McGill and Washington
make no mention of two of these processes - empowerment for
both, and economic and cultural processes respectively.
UBC is explicit in both its mission statement and courses about five of
these processes - urbanization, political, economic, environmental
, and empowerment . Although UBC makes no mention in the mission
statement of cultural processes, it was apparent in the courses.
Subject Coverage in the Core Curriculum
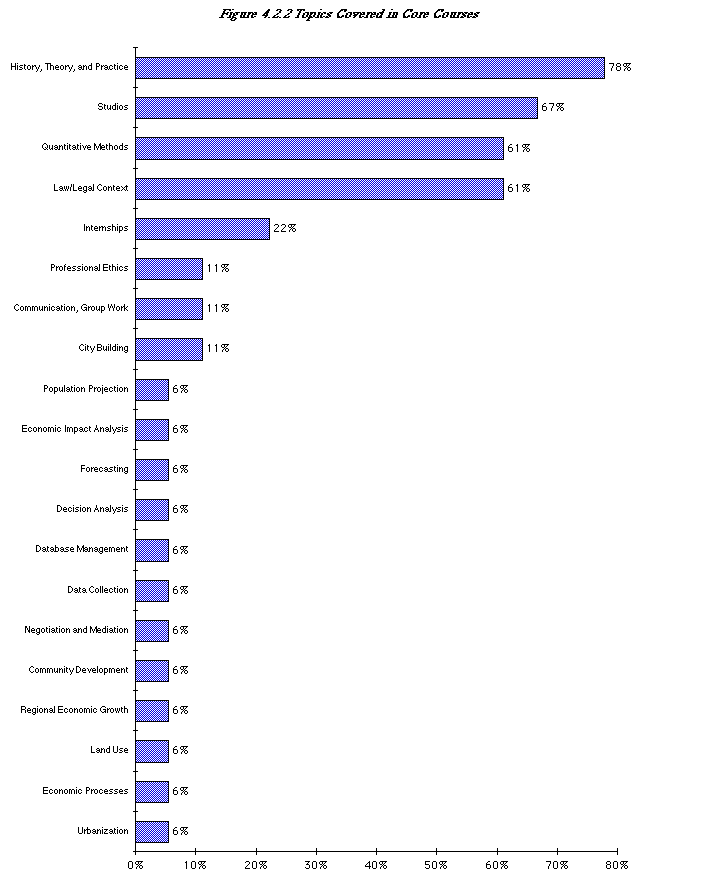
All topics that scored a 1.1 (core course) are shown in Figure
4.2.2 as a percentage of schools covering that topic. Four broad categories
leap out -- history, theory, and practice (78%), studios (67%), law/legal
context (61%), and quantitative methods (61%). Additional topics are shown,
but generally represent only one to four schools. There are no other broad
subject areas that are commonly covered. Note that this study looked at
the schools based on a common list of subjects, but did not take a complete
list of core subjects and generate a comprehensive list of topics taught
at each school. A description of each program is available in Appendix A.
Friedmann did do this latter kind of analysis in his article and the most
glaring discrepancy in terms of a frequent core course that did not appear
in our analysis is economics. This is in part because economics courses
are addressed in three areas - sociospatial processes, area of concentration,
and economic analysis, which in our list is treated as a methods course.
Even if these three economic categories are combined, they are core requirements
in only 18% of the schools. With the exception of quantitative methods,
the general trend above is reflected in the core topics at UBC, where history
and theory, studios, and legal context form the heart of the core curriculum.
Figure 4.2.2 Topics Covered in Core Courses
Frequent Concentrations Offered and Subject Coverage in Common Areas
of Concentrations
Two aspects of concentration areas were examined -- the frequency
of key topics in schools concentration offerings and course coverage based
on Friedmanns list of common areas of concentration (refer to Table 4.2.1),
to which design/site planning was added and redevelopment was renamed as
urban development.
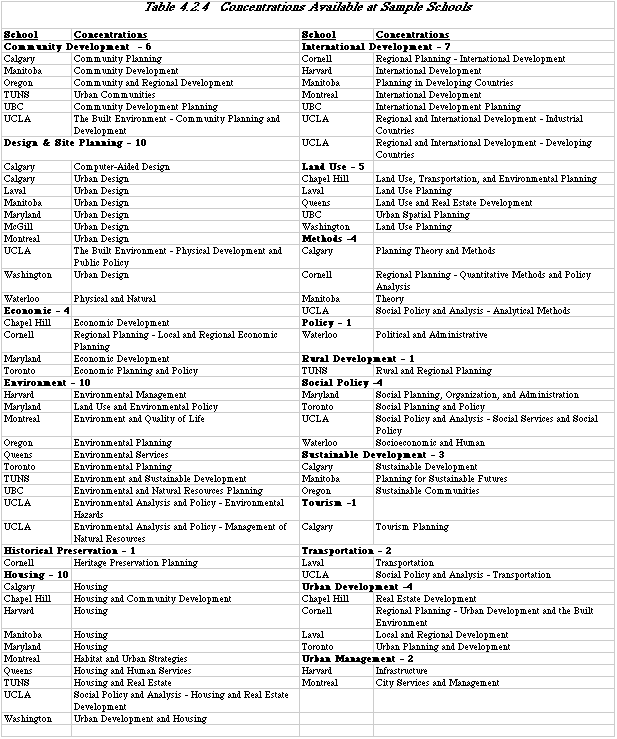
By taking the areas of concentration offered by the schools and lumping
them into broader categories, based again on Friedmanns subject categories
where applicable (Table 4.2.4), an overview of the frequency of concentrations
or streams is achieved. This is shown graphically in Figure 4.2.3 (bottom
bar) along with the degree of explicit coverage for those topics assessed
(top bar). The most commonly available concentration is the environmental
field at 56%, though it should be noted that UCLA has two separate concentrations
under this category. This is followed by housing at 50% and design/site
planning and urban development both at 39%. A few concentrations emerged
which did not fit into these categories. They were methods (17%), sustainable
development (11%), policy, rural planning, tourism planning, and computer
applications all at 6%, (i.e. only available at one school, 1:18). York
did not specify any concentrations implying that it was to be defined in
each individual program of study and listing almost 40 areas of faculty
interest that could support a student interest. Several other schools (such
as Cornell, Calgary, McGill, and Washington) suggested some concentrations
that were available, but did not seem to restrict the subjects that a student
could choose as their area of focus, or require that one be chosen.
The degree of explicit course coverage of the major areas of concentration
-- schools receiving a 1.1, 1, or 2 for each subject -- was assessed. Figure
4.2.3 shows the results as the top bar. Environment and land use are both
explicitly covered at 100% of the schools. Most of the topics are covered
by a majority of schools. UBC explicitly covers all of these concentration
areas in its courses, which would allow a student to gain exposure to many
of the interrelated subareas of planning. It is also clear that you cannot
even get exposure to, much less full coverage of, all of these areas at
every school, although they are obviously all key areas in the field of
planning.
Figure 4.2.3 Area of Concentration and Subject Coverage in
Courses
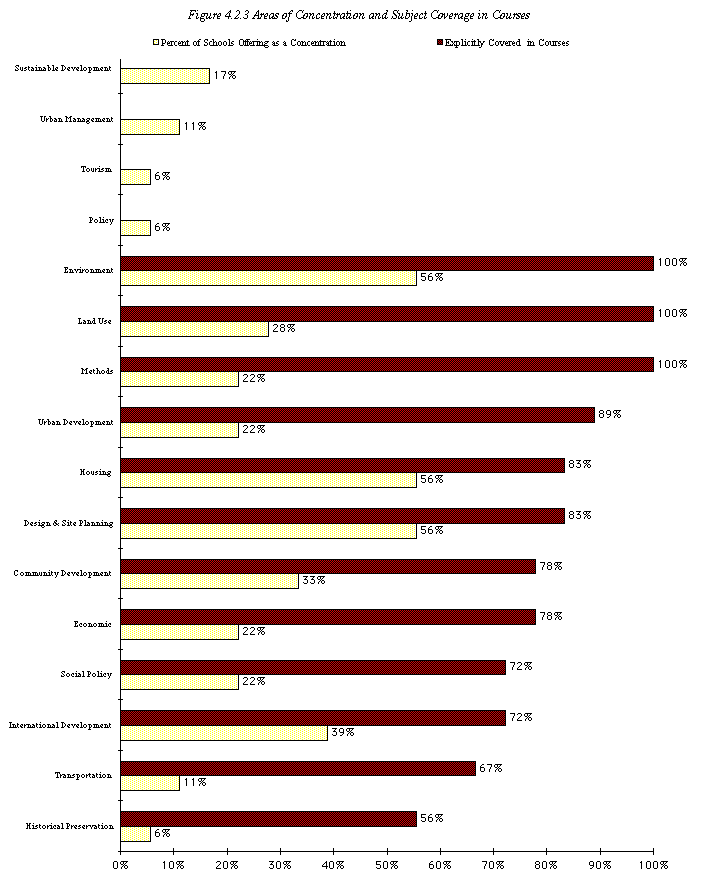
Table 4.2.4 Concentrations Available at Sample Schools
Methods Courses
General methods, based on Friedmanns classifications, are presented
in Figure 4.2.4 as the percentage explicitly referred to in the course descriptions.
Figure 4.2.4 Explicit Course Coverage of Methods Topics
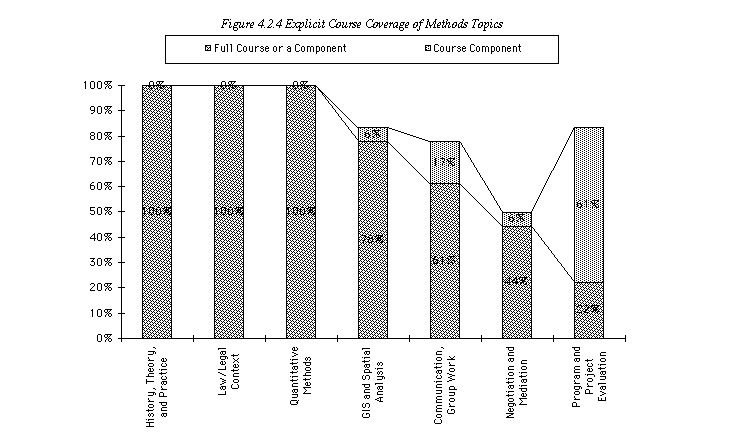
With 78% of programs offering a full course in GIS and Spatial Analysis
and 83% of programs offering some explicit coverage of program and project
evaluation, UBC is somewhat under par in these two areas. UBC is among the
44% of programs offering a full course in negotiation and mediation, addressing
an area that many programs lack.
The sixteen quantitative methods topics shown in Figure 4.2.5 were derived
from the aforementioned Kaufman and Simons article. Based on their practitioner
ranking of current and future importance, these sixteen topics (along with
algebra and calculus) were selected as having the greatest combined current
and future demand or importance. Algebra and Calculus were omitted because
they are not taught in any program and could generally be considered a prerequisite
to admission. The others are listed in order of importance from left (highest)
to right (lowest). As is evident from the lack of correlation between the
ranking and the percentage explicitly covered, current and future demand
in the workforce and availability in a graduate program are not clearly
related. Furthermore, most of the topics which are not addressed are in
the top half of the range (e.g. more important). This is true for UBC as
well.
Figure 4.2.5 Explicit Course Coverage of Quantitative Methods Topics
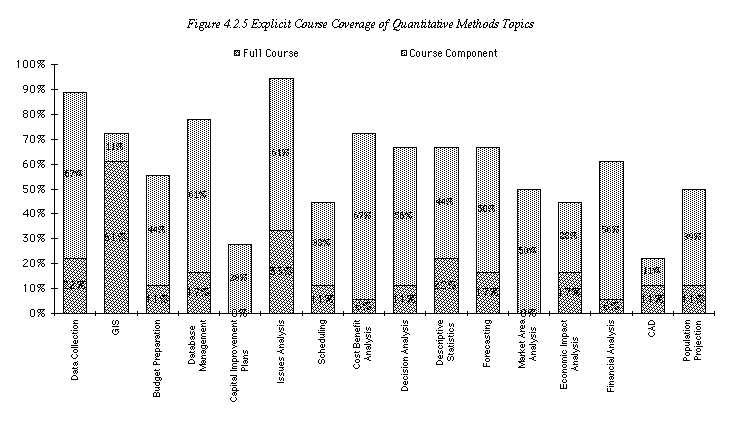
Overall about five of the topics are at 50% or below, including Capital
Improvement Plans, Scheduling, Market Area Analysis, CAD, and Population
Projection. Several others hover around 70%, while only Data Collection
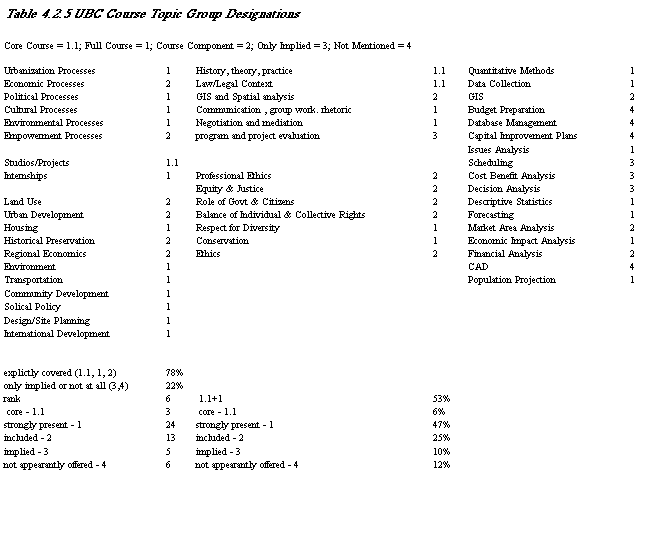
(89%) and Issues Analysis (94%) stand out as widely taught. UBC only explicitly
addresses nine of these topics. Table 4.2.5 shows the groupings assigned
to UBC for each of the topics.
Table 4.2.5 UBC Course Topic Group Designations
Conclusions
Program Structure
UBCs program structure is difficult to generalize about since the four streams
have three separate course requirement structures. Overall the common core
requirements are fairly minimal in comparison to other schools, (yet as
mentioned under the content section they reflect the most common core courses).
The area of concentration reuqirements vary from none (proportion and content)
in the international and community development streams, to five courses
(13 credits) in natural resources, to eight courses with only some choice
in urban spatial structure.
UBC is one of four schools with an appearantly strict academic thesis, and
eight schools with a single thesis option with a fixed number of credits.
Program Content
UBC is explicit in both its mission statement and courses about five of
the sociospatial processes - urbanization, political, economic,
environmental , and empowerment . Although UBC
makes no mention in the mission statement of cultural processes,
it was apparent in the courses.
With the exception of quantitative methods, the general trend in core topics
is reflected at UBC, where history and theory, studios, and legal context
form the heart of the core curriculum.
UBC explicitly covers all of the concentration areas in its courses, which
would allow a student to gain exposure to many of the interrelated subareas
of planning.
UBC only explicitly addresses nine out of sixteen of the quantitative methods
topics, and mirroring the general trend, does not necessarily cover the
ones rated of highest importance.


